Usage
Command Line Scripts
After installing the vegindex package, three python command line
scripts will be installed:
generate_roi_timeseriesupdate_roi_timeseriesplot_roistatsgenerate_summary_timeseriesgenerate_roi_ir_timeseriesupdate_roi_ir_timeseriesgenerate_ndvi_timeseriesgenerate_ndvi_summary_timeseries
These scripts allow you to reproduce the PhenoCam network “standard timeseries products” from downloaded data. For a description of the products see the project Tools Page.
Setting up the Data Directory
The vegindex package is designed to work with images downloaded from the PhenoCam network server. To download images you can go to the data tab at the project website.
The images you select come in a zip file with a specific directory
structure. For example if we download data from the harvard site.
harvard
├── 2009
│   ├── 01
│   │   ├── harvard_2009_01_01_110135.jpg
│   │   ├── harvard_2009_01_01_113135.jpg
│   │   ├── harvard_2009_01_01_120135.jpg
 .
 .
 .

│   └── 06
│       ├── harvard_2009_06_01_110139.jpg
│       ├── harvard_2009_06_01_113139.jpg
│       ├── harvard_2009_06_01_120139.jpg
│       └── harvard_2009_06_01_123139.jpg
├── harvard_meta.json
└── harvard_meta.txt
where the we have a top level directory for sitename then
subdirectories for four-digit year and two-digit month, with
the image files in the month directories. This is the general
structure that this package will expect the image data to be
in.
Site-Level Metadata
The package scripts have several ways to get site-level metadata. One
level above the site directories you can place a text file (with a
default name of site_info.csv). If this file is present the
scripts will read basic site-level metadata from this file. Here’s an
example:
# This is a site info file
sitename,lat,lon,elev,start_date,end_date,tzoffset,nimage
test,40.00000,-60.00000,300,2008-04-04,2017-11-23,1,300
test2,45.00000,-65.00000,1300,2008-04-04,2017-11-23,1,300
If you download images using the link above you will have this information in the included site metadata file. If this file is not present the script try to use the network to get the latest version of this information by pulling information from our server. The pathname of the site-level metadata file can be set using the PHENOCAM_SITE_INFO environment variable.
ROI Lists and Masks
Once you’ve selected and downloaded the data you would like to process
you will need to set up a region of interest (ROI) using an ROI List
file and the associated ROI Mask images.
The ROI List file is a simple text file with
a list of ROI mask images and the dates for which the masks are
valid. The ROI List format description can be found
on this page
Here’s a simple example where there is only one mask file:
#
# ROI List for harvard
#
# Site: harvard
# Veg Type: DB
# ROI ID Number: 0001
# Owner: tmilliman
# Creation Date: 2012-07-12
# Creation Time: 11:42:00
# Update Date: 2014-12-17
# Update Time: 13:55:25
# Description: Deciduous trees in foreground
#
start_date,start_time,end_date,end_time,maskfile,sample_image
2008-04-04,00:00:00,9999-01-01,00:00:00,harvard_DB_0001_01.tif,harvard_2008_04_30_133137.jpg
If there are field-of-view shifts you may need additional lines in the
list and more mask images. The list file and the mask images need to be
placed in a directory named ROI under the site name i.e.:
harvard
└── ROI
    ├── harvard_DB_0001_01.tif
    └── harvard_DB_0001_roi.csv
This file naming convention must also be followed. So the ROI List
has the form:
<sitename>_<ROI-type>_<ROI-sequence-no>_roi.csv
and the associated masks are named according to the convention:
<sitename>_<ROI-type>_<ROI-sequence-no>_<mask_index>.tif
where the “<mask_index>” in the form nn is the number in the list
of the mask file starting with 01 (e.g. 01, 02, 03, etc.). For the
timeseries displayed on the PhenoCam Network website. The ROI
List files and the ROI Mask images are available for download
from one of the ROI Pages on our site e.g. ROI page for harvard
DB_0001
Generating the ROI Image Statistics file
The generate_roi_timeseries script reads in the ROI List
file and ROI Mask images. Then for each image found within the
timeperiods in the ROI List it calculates image statistics over
the ROI. You can get help for
$ generate_roi_timeseries -h
usage: generate_roi_timeseries [-h] [-v] [-n] site roiname

positional arguments:
site           PhenoCam site name
roiname        ROI name, e.g. DB_0001

optional arguments:
-h, --help     show this help message and exit
-v, --verbose  increase output verbosity
-n, --dry-run  Process data but don't save results
The script needs to know where the site images are located. By default it assumes that the site level image directory is at:
/data/archive/<sitename>
If the images downloaded are in another location, for example
/mydata/directory/harvard, you can set an an
environment variable to specify the path to the images:
export PHENOCAM_ARCHIVE_DIR=/mydata/directory/
or
set PHENOCAM_ARCHIVE_DIR=/mydata/directory/
All of the scripts assume the same data layout both for reading and writing.
Here’s an example command line session for a bash shell:
$ export PHENOCAM_ARCHIVE_DIR=~/Downloads/phenocamdata/
$ generate_roi_timeseries harvard DB_0001
Images processed: 594
Images added to CSV: 594
Total: 594
The output format for the “All Image” file can be found here The output CSV file is written to the ROI directory and will follow the name convention: <sitename>_<vegtype>_<seqno>_roistats.csv
Generating the 1-day and 3-day Summary Files
The generate_summary_timeseries script reads in the “All-Image”
file and calculates summary statistics for the 1-day or 3-day period:
$ generate_summary_timeseries -h
usage: generate_summary_timeseries [-h] [-v] [-n] [-p [{1,3}]] site roiname

positional arguments:
site                  PhenoCam site name
roiname               ROI name, e.g. canopy_0001

optional arguments:
-h, --help            show this help message and exit
-v, --verbose         increase output verbosity
-n, --dry-run         Process data but don't save results
-p [{1,3}], --aggregation-period [{1,3}]
                      Number of Days to Aggregate (default=1)
To generate the 3-day summary file from the “All Image” file generated in the previous section:
$ generate_summary_timeseries -p 3 harvard DB_0001
Total: 51
A description of the summary files can be found on the project website. The output CSV file is also written to the ROI directory and will follow the name convention: <sitename>_<vegtype>_<seqno>_[13]day.csv.
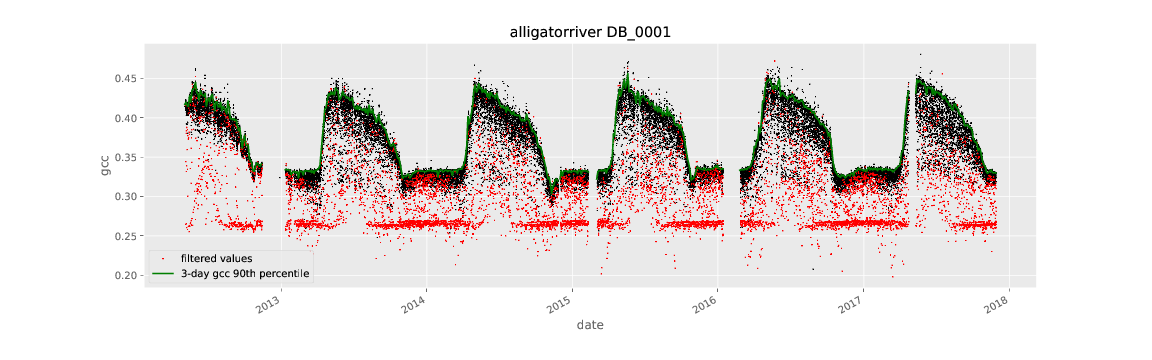
Running plot_roistats
The plot_roistats python script reads the output of
generate_roi_timeseries and the 3-day summary generated by
generate_summary_timeseries script. The gcc values for individual
images are plotted as points and the three-day 90th-percentile summary
is plotted as a line. The color of the plotted points is used to show
which data (in red) are filtered before calculating the summary
statistics. The default filtering is shown and eliminates values
where the sun elevation angle is low (< 10 degrees) and the mean
brightness over the ROI is either low (< 100.) (very dark image)
or high ( > 665.) (washed out image).
$ plot_roistats -h
usage: plot_roistats [-h] [-v] site roiname

positional arguments:
  site           PhenoCam site name
  roiname        ROI name, e.g. DB_0001

optional arguments:
  -h, --help     show this help message and exit
  -v, --verbose  increase output verbosity
The script places the output .pdf file in the ROI directory alongside the .csv files used to produce the plot.
Processing IR Images
Starting with vers 0.10.0 scripts have been added to process the associated IR images. These are used to calculate the ‘camera NDVI’ timeseries for a given ROI. These scripts rely on having the ‘.meta’ files available to extract the exposure values for both the RGB and IR images. For some sites these ‘.meta’ files are not available.
Generating the camera NDVI time series CSV files involves several steps and understanding the process is helpful:
- generate the RGB ROI timeseries
- generate the IR ROI timeseries
- combine these two files (matching the RGB and IR images) to calculate camera NDVI values for each RGB/IR image pair
- create 1-day and 3-day of the camera NDVI values
Generating the ROI IR Image Statistics File
The generate_roi_ir_timeseries script reads in the ROI List
file and ROI Mask images. Then for each IR image found within the
timeperiods in the ROI List it calculates IR image statistics over
the ROI. You can get help for
$ generate_roi_ir_timeseries -h

usage: generate_roi_ir_timeseries [-h] [-v] [-n] site roiname

positional arguments:
  site           PhenoCam site name
  roiname        ROI name, e.g. DB_0001

optional arguments:
  -h, --help     show this help message and exit
  -v, --verbose  increase output verbosity
  -n, --dry-run  Process data but don't save results
The output CSV file is again written to the ROI directory and will follow
the name convention: <sitename>_<vegtype>_<seqno>_IR_roistats.csv.
Generating the camera NDVI (RGB/IR Image Pair Statistics) File
The generate_ndvi_timeseries script reads in the RGB roistats
CSV file and IR roistats CSV file. Then for each
RGB image the script tries to locate the matching IR image. If a
match is found then values from the two lines are combined to form
a single line with the camera NDVI values.
$ generate_ndvi_timeseries --help
usage: generate_ndvi_timeseries [-h] [-v] [-n] site roiname

Merge RGB and IR stats and calculate camera NDVI

positional arguments:
  site           PhenoCam site name
  roiname        ROI name, e.g. canopy_0001

optional arguments:
  -h, --help     show this help message and exit
  -v, --verbose  increase output verbosity
  -n, --dry-run  Process data but don't save results
The output file will be written to the ROI directory and will have a
name like <sitename>_<vegtype>_<seqno>_NDVI_roistats.csv.
Generating the 1-day and 3-day Summary Files
The generate_ndvi_summary_timeseries script reads in the “NDVI roistats”
file and calculates summary statistics for the 1-day or 3-day period:
$ generate_ndvi_summary_timeseries --help

 usage: generate_ndvi_summary_timeseries [-h] [-v] [-n] [-p [{1,3}]]
                                         site roiname

 Generate a summary/aggregated NDVI file

 positional arguments:
   site                  PhenoCam site name
   roiname               ROI name, e.g. canopy_0001

 optional arguments:
   -h, --help            show this help message and exit
   -v, --verbose         increase output verbosity
   -n, --dry-run         Process data but don't save results
   -p [{1,3}], --aggregation-period [{1,3}]
                         Number of Days to Aggregate (default=1)
The output filename will follow the convention, <sitename>_<vegtype>_<seqno>_ndvi_[13]day.csv.
TBD